Debug Playwright Tests with --debug=cli and Agent Trace Commands
Pause a Playwright test for agent attachment, inspect it with playwright-cli, analyze trace.zip from the terminal, and record separate agent session traces.
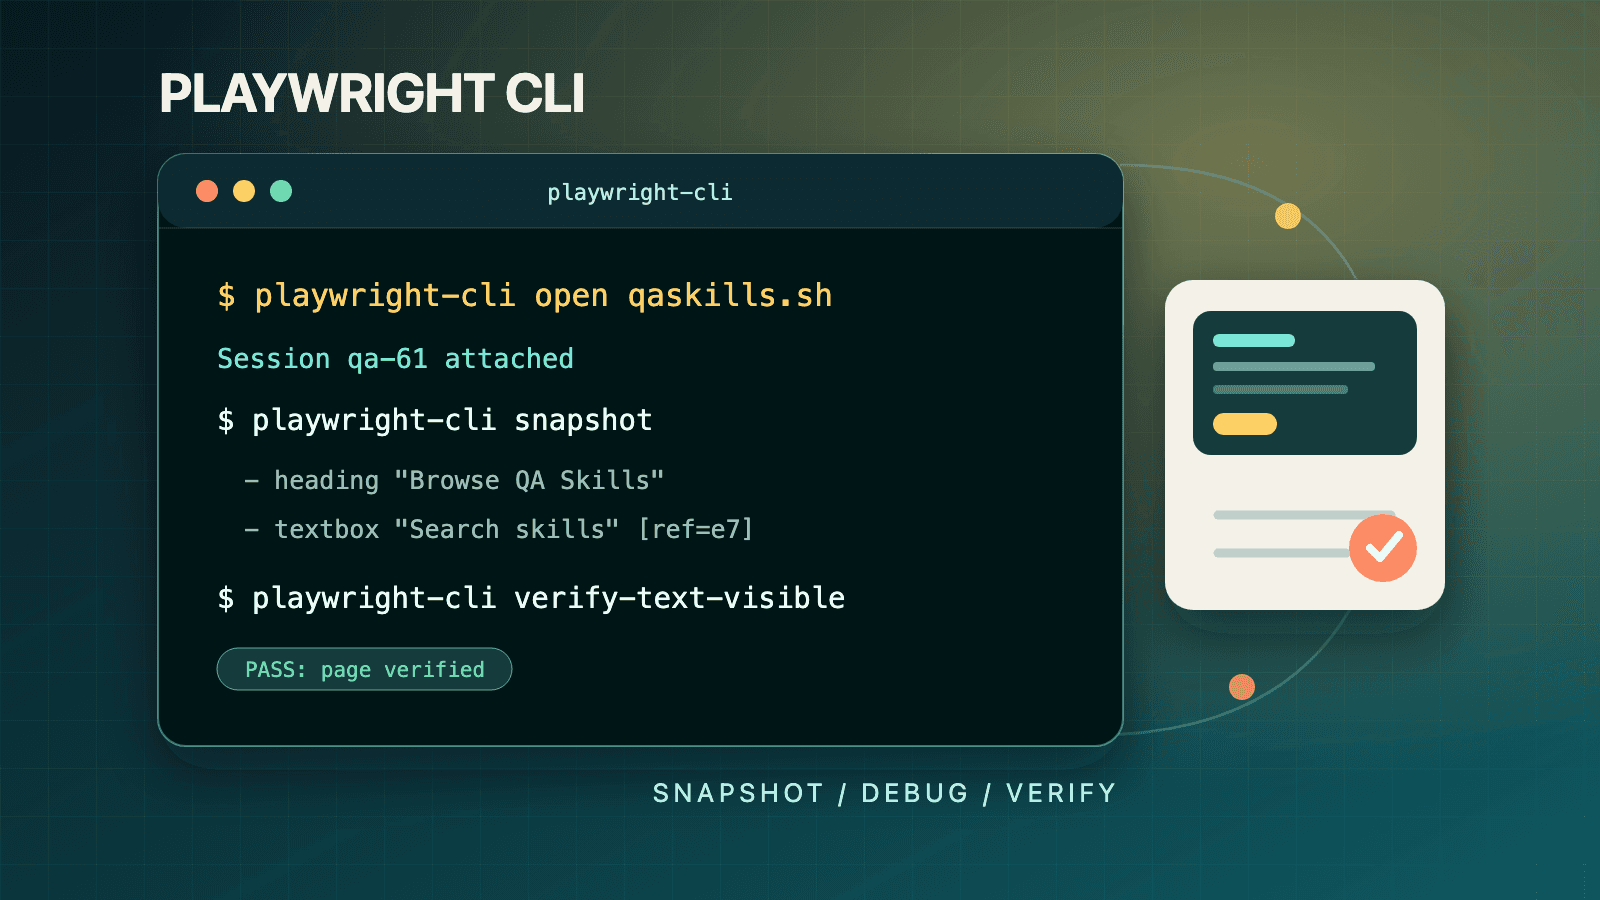
Run a failing test with npx playwright test tests/example.spec.ts --debug=cli, copy the session name printed by the paused runner, and connect with playwright-cli attach <session-name>. Then use snapshot, console error, network, step-over, and resume against the live test. For a completed run, analyze its trace.zip with npx playwright trace open, actions, action, snapshot, and close. These are distinct live and post-run workflows.
There is a third trace path for an ordinary agent-controlled browser: playwright-cli tracing-start and tracing-stop. Keeping those three surfaces separate is the main requirement for correct 1.61-era debugging. This guide shows when each one applies, how to preserve evidence, and how an agent should turn observations into a minimal, reviewable fix rather than guessing from the final error line.
Four Similar-Looking Tools, Four Different Jobs
Playwright now exposes several terminal debugging paths. The word "trace" appears in more than one, and --debug=cli deliberately bridges two executables. Use this reference before choosing commands:
| Goal | Start command | Follow-up interface | Best for |
|---|---|---|---|
| Inspect a test while it is paused | npx playwright test --debug=cli | playwright-cli attach <printed-name> plus live commands | Current DOM, console, network, stepping, and breakpoints |
| Analyze a saved test trace without a GUI | npx playwright trace open path/to/trace.zip | npx playwright trace actions/action/snapshot/close | Agent-friendly postmortem analysis |
| Record an ad hoc agent browser flow | playwright-cli tracing-start | Agent CLI actions, then tracing-stop | Evidence for a manual or autonomous browser scenario |
| Explore a saved trace visually | npx playwright show-trace path/to/trace.zip | Trace Viewer UI | Human timeline, DOM, screenshot, network, and console review |
Only the first row uses --debug=cli. Only the second uses the newer npx playwright trace command family for terminal analysis. The third records the dedicated CLI's current browser session. The fourth opens a visual viewer. A trace archive can be useful in more than one workflow, but the commands are not aliases.
The dedicated playwright-cli package must be installed for live attachment and ad hoc session commands. Playwright Test must be installed in the test project for npx playwright test, npx playwright trace, and show-trace. Follow the Playwright CLI skills setup if the agent executable is missing.
Start a Test with --debug=cli
Run the narrowest failing test you can identify:
npx playwright test tests/checkout.spec.ts --debug=cli
The runner pauses at the start and prints debugging instructions with a generated session name. The official examples show names such as playwright-test-1 and tw-87b59e; your output is authoritative. Do not hard-code either example in a script or assume the next run will reuse it.
Keep that runner process alive. In another terminal, attach using the exact value it printed:
playwright-cli attach tw-87b59e
playwright-cli --session=tw-87b59e snapshot
playwright-cli --session=tw-87b59e console error
playwright-cli --session=tw-87b59e screenshot --filename=paused-test.png
The release notes show the long --session form in generated instructions; the agent CLI documentation also uses a default attached session and the -s shorthand. Copy the command form printed by your installed version when possible. The generated name is more important than choosing short or long option spelling.
At this point, the browser belongs to the paused test. You are not launching an independent page and replaying an approximation. Fixtures, storage, routes, test data, browser project, and application state created by the test remain available. That fidelity is why live attachment is valuable for failures that disappear when reproduced manually.
Inspect Before You Resume
Start with non-mutating observations:
playwright-cli snapshot
playwright-cli console error
playwright-cli eval "() => document.title"
playwright-cli screenshot --filename=debug-state.png
The snapshot exposes the paused page's accessibility tree and current refs. Console filtering can reveal uncaught application errors. A narrow eval can inspect a property that snapshots do not represent. A screenshot records visual state. Add playwright-cli network when the failure may depend on a request, response, redirect, or missing resource.
Prefer observation before mutation. Clicking a control, editing storage, or evaluating code that changes the page can destroy the evidence you are trying to explain. If you deliberately perturb state to test a hypothesis, label that evidence as an experiment rather than the original failure.
Refs in the paused snapshot are still short-lived. After stepping a navigation or action, read the new snapshot before using another ref. The accessibility snapshots and refs guide explains why a ref copied before step-over may no longer identify a target afterward.
Control Test Execution
The agent debugger documents three execution controls:
playwright-cli step-over
playwright-cli resume
playwright-cli pause-at tests/checkout.spec.ts:42
step-over advances to the next action, making it the safest way to correlate one test operation with one change in page, network, or console state. resume continues execution, so use it when you have a breakpoint or are ready for the test to proceed. pause-at sets a source location where execution should pause.
A disciplined loop is:
- Snapshot and inspect console/network at the current pause.
- Record a hypothesis about the next action.
- Run
step-over. - Compare page state and diagnostics.
- Repeat until the first divergence from expected behavior.
- Capture evidence before experimenting with a fix.
Do not step through every line simply because the controls exist. If the failure is an assertion against a missing success message, focus on the action that should create it, the triggering request, and the resulting page state. The goal is the earliest causal divergence, not the largest artifact set.
Record a Trace During Live Agent Debugging
The official flaky-test workflow starts a trace after attachment, steps the test, and then stops recording:
playwright-cli tracing-start
playwright-cli resume
playwright-cli snapshot
playwright-cli console
playwright-cli network
playwright-cli screenshot --filename=before-failure.png
playwright-cli tracing-stop
This records the attached browser activity observed during that interval. Start before the actions you need and stop while the session is still available. A trace that begins after the failure cannot recover earlier DOM snapshots or network activity that were never recorded.
The live debugger and trace complement each other. Live commands answer an immediate question and can control execution. The saved trace preserves a timeline for later review. Always retain the original test failure output as well, because a debugging run may have different timing from the failing CI attempt.
Generate a Playwright Test Trace for Postmortem Work
If a failure already happened, a trace from that exact attempt is usually stronger evidence than rerunning immediately. Playwright Test accepts the documented --trace <mode> option. For a focused reproduction, force tracing on:
npx playwright test tests/checkout.spec.ts --trace=on
The test CLI supports modes including on, off, on-first-retry, on-all-retries, retain-on-failure, retain-on-first-failure, and retain-on-failure-and-retries. A CI policy usually prefers a failure/retry retention mode to avoid recording every successful test. A local one-test reproduction can use on for certainty.
Read the runner output or report to locate the actual trace.zip. Do not assume every project writes the same directory; output paths can vary by project, test, retry, and configuration. Copy the archive before a cleanup step removes test results.
Playwright 1.61 traces and HAR recordings include WebSocket requests, which matters for failures in live updates, collaborative applications, and subscription-driven UIs. That improves evidence but can also increase artifact sensitivity and size.
Analyze trace.zip from the Terminal
Playwright's release notes document an agent-oriented trace command sequence:
npx playwright trace open test-results/example-has-title-chromium/trace.zip
npx playwright trace actions --grep="expect"
npx playwright trace action 9
npx playwright trace snapshot 9 --name after
npx playwright trace close
open selects and summarizes the archive. actions lists its actions, and --grep narrows that list. action 9 displays details for the numbered action, including its error and available snapshots. snapshot 9 --name after prints the named before/after state when available. close ends the trace analysis session.
The number 9 is sample output from the official release notes, not a universal failure index. Run actions, find the relevant row in your trace, and use its number. An assertion may have before and after snapshots, while another operation may expose a different set. Follow the availability reported by action <number>.
A useful narrowing strategy is:
- Grep for
expectto locate failing assertions. - Inspect the failed assertion's expected and received values.
- Read its before and after snapshots.
- Move backward to the action that should have produced the expected state.
- Compare timing and network evidence in Trace Viewer when terminal output is insufficient.
Terminal analysis is especially useful for coding agents because it returns compact text rather than requiring visual navigation through a large trace. It does not make the GUI obsolete. Open the same archive with npx playwright show-trace when layout, screenshots, request bodies, timing bars, or source context require human inspection.
Record an Ordinary playwright-cli Session
Not every failure begins in a Playwright Test file. For exploratory automation or an agent verification flow, record the dedicated CLI session directly:
playwright-cli tracing-start
playwright-cli goto https://demo.playwright.dev/todomvc/
playwright-cli type "Trace this todo"
playwright-cli press Enter
playwright-cli screenshot --filename=trace-result.png
playwright-cli tracing-stop
The official tracing guide reports the default archive at .playwright-cli/trace.zip. View it with:
npx playwright show-trace .playwright-cli/trace.zip
This trace describes agent CLI actions, not a hidden Playwright Test run. It will not contain test fixtures, assertion metadata, or steps that never occurred in that browser session. Name and store evidence so reviewers know whether an archive came from a CI test attempt, a live attached debugging interval, or a manual agent reproduction.
A Practical Failure Triage Sequence
Use evidence cost and fidelity to choose the path:
- Preserve the original error, report, screenshot, video, and trace from the failing attempt.
- If a trace exists, use
npx playwright tracefor compact postmortem analysis before rerunning. - If the trace lacks the decisive state, rerun only the affected test with
--debug=cli. - Attach using the printed session name and inspect before resuming.
- Step to the earliest action where actual state diverges.
- Record a narrow live trace if the transition needs a shareable timeline.
- Make the smallest code or product change supported by evidence.
- Run the test normally and under its relevant project/retry conditions.
This order avoids destroying a rare flaky failure with a clean local rerun. It also keeps the agent from editing test waits or selectors before establishing whether the product, test, environment, or data is wrong.
Compare Failing and Passing Attempts
A flaky test often needs two timelines: the failing attempt and a nearby passing retry under the same project and data conditions. Compare the earliest action whose duration, request outcome, console state, or after-snapshot differs. The final assertion may be identical in both traces while the real divergence occurred several actions earlier.
Keep the comparison controlled. Confirm browser project, test parameters, retry index, worker context, application revision, and environment before attributing a difference to timing. A trace from local Chromium and one from a failing CI WebKit project can suggest hypotheses, but it is not an isolated experiment.
Playwright's failure-and-retry trace modes are useful because they can retain evidence around the attempts that matter. Still, artifact presence does not prove causality. Build a short evidence table with the action, failing observation, passing observation, and proposed mechanism. Then change one condition and rerun. This prevents an agent from selecting the most visually obvious difference while ignoring a data collision or upstream request failure.
If only the failing trace exists, preserve it before generating new attempts. A passing rerun is comparison evidence, not a replacement for the original failure. If only a passing trace exists, do not invent the missing state; reproduce under matching conditions or report that the root cause remains unconfirmed.
From Evidence to a Safe Fix
Classify the cause before changing code:
| Evidence | Likely class | Better response than adding a delay |
|---|---|---|
| Snapshot shows the expected control under a different accessible name | Locator or product accessibility contract changed | Confirm intended UI, then update product semantics or locator |
| Network shows a failed API response | Product, environment, or test data issue | Fix request/data/environment and assert the meaningful outcome |
| Action starts before prerequisite UI is ready | Missing web-first condition | Wait through a locator assertion tied to user-visible readiness |
| Test passes alone but trace shows shared account state | Isolation defect | Provision unique data or reset state; do not increase timeout |
| Console shows an uncaught exception before assertion | Product defect | Fix the application error and retain a regression test |
| Before/after snapshots show click had no state effect | Wrong target, overlay, or disabled control | Improve targeting and verify actionability rather than force-clicking |
An agent should report the evidence chain: failing action, relevant state before, observed event, state after, root-cause hypothesis, and validation. "Increased timeout and it passed" is not a diagnosis unless evidence proves the operation legitimately needs the new budget.
Common Mistakes
Treating --debug=cli as an agent browser launcher
It is an option on npx playwright test. It pauses a test and prints a target for the separate playwright-cli executable to attach to.
Hard-coding the generated session name
Read each run's output. Names in documentation are examples and can change between attempts.
Letting the runner process exit before attachment
The paused test must remain alive. Use another terminal or an agent process to connect while the original command waits.
Resuming before collecting original state
Once execution continues, the page and evidence may change. Snapshot, console, network, and screenshot first.
Reusing refs after step-over
The test action may navigate or re-render. Read the refreshed snapshot before selecting the next ref.
Calling npx playwright trace without a trace archive
The terminal analyzer reads a saved trace.zip. Enable an appropriate trace mode before the run or retrieve the artifact from CI.
Confusing trace analysis with Trace Viewer
npx playwright trace exposes agent-friendly terminal subcommands. npx playwright show-trace opens the visual viewer.
Recording the wrong interval
Starting tracing-start after the failure cannot reconstruct previous actions. Define the suspect transition and start before it.
Publishing secrets in trace artifacts
Traces can contain DOM, network, console, and source information. Treat them as sensitive test artifacts, redact where appropriate, and apply retention controls.
Troubleshooting --debug=cli and Trace Commands
| Symptom | Likely cause | Next check |
|---|---|---|
--debug=cli is rejected | Playwright Test version is too old or wrong executable is running | Confirm project Playwright version and npx playwright test --help |
| Test waits but no agent is attached | Generated session name was missed | Read the runner's debugging instructions and copy the exact attach command |
| Attach says target not found | Runner exited, name is wrong, or target belongs elsewhere | Confirm the paused process is alive and use current output |
| Snapshot is unrelated to the failure | Wrong CLI session is active | Address the generated debug session explicitly |
| Step command has no target | CLI is not attached to a paused test | Attach first; ordinary sessions do not expose test debugger controls |
No trace.zip exists | Tracing was not enabled or artifact was cleaned | Use a supported trace mode and preserve test results |
trace action 9 is invalid | Example index was copied | Run trace actions and choose an index from your archive |
| Requested before/after snapshot is unavailable | That action did not record the named snapshot | Inspect trace action <n> for available names |
| Debug run passes while CI failed | Timing, data, project, or environment differs | Analyze original CI trace and reproduce the same conditions |
| Trace is too sensitive to share | DOM/network/source contains protected data | Restrict access, redact or reproduce with safe data, and enforce retention |
If commands differ from this guide, use help from the installed Playwright Test and agent CLI versions. Do not blend a latest global playwright-cli with an old project runner and assume every newer bridge command is available.
Frequently Asked Questions
What exactly does --debug=cli do?
It runs Playwright Test in CLI debugger mode, pauses execution, and prints a session name that playwright-cli can attach to. It is designed for agentic debugging without requiring the Inspector GUI.
Is --debug=cli the same as --debug?
No. The traditional --debug path defaults to Playwright Inspector. The cli mode exposes the paused test to the dedicated agent CLI. Use the explicit mode when an agent will debug from terminal commands.
Do I run attach in the same terminal?
Use another terminal or agent process so the paused test command remains running. Attach to the exact name printed by that process.
When should I use step-over instead of resume?
Use step-over when isolating the first bad transition and comparing state action by action. Use resume when you have collected current evidence and want execution to continue, often toward a breakpoint.
What is npx playwright trace?
It is the terminal trace-analysis command family documented in Playwright's release notes. After opening a trace archive, an agent can list actions, inspect one action, print its available snapshot, and close the analysis session.
How is npx playwright trace different from tracing-start?
npx playwright trace reads an existing Playwright Test trace. playwright-cli tracing-start begins recording the current agent CLI browser session. One analyzes; the other records.
Can I still use Trace Viewer?
Yes. Run npx playwright show-trace path/to/trace.zip for visual timeline analysis. Terminal commands are efficient for agents; the viewer is often better for humans inspecting screenshots, timing, DOM, and network detail.
Should I enable trace=on for the whole CI suite?
Usually choose a failure or retry retention mode to control storage and sensitive data. Use on for a focused reproduction when recording every attempt is intentional. Match policy to flake frequency, artifact cost, and compliance requirements.
Can the debugger change the paused page?
Yes. CLI interactions and mutating eval calls can alter state. Observe first, label experiments, and rerun from a clean fixture before treating modified-state behavior as the original failure.
Does Playwright 1.61 add anything relevant to traces?
Yes. The 1.61 release notes say HAR and trace recordings include WebSocket requests. The CLI debugger and terminal trace-analysis workflow were introduced earlier and remain part of the current workflow.
Related Guides and Official Sources
Use the complete Playwright CLI guide for the wider agent command model, install Playwright CLI skills before attaching, and review snapshot ref lifetime before stepping. For concurrent debugging without browser collisions, follow the parallel sessions guide. Browse QA skills and the Playwright CLI skill for reusable agent workflows.
The exact commands are documented by Playwright in the official test debugging, agent session tracing, test CLI, and release notes. Preserve the original artifact, choose the live or postmortem surface deliberately, and let the earliest supported divergence drive the fix.